
US Public Health & Pharmacovigilance
02 FAERS Database Made Easy
$529.00
FAERS Database Made Easy by Pharma Co-pilot
The Post-Market Safety Signal Project: A Deep Dive into Pharmacovigilance Using FAERS
What happens after a drug is approved and prescribed to millions? The controlled, clean environment of a clinical trial gives way to the complex, unpredictable reality of the real world. This is where the true test of a drug’s safety profile begins, and where the field of pharmacovigilance becomes absolutely critical. This project is your deep dive into that world, an immersive, practical journey into post-market drug safety using one of the most important and challenging FAERS dataset (FDA’s Adverse Event Reporting System).
The Core Question We’ll Answer
“For a specific marketed drug, what are the most frequently reported adverse events in the FAERS database, and how can we stratify these findings by key patient demographics (e.g., age, sex) to identify at-risk populations?”
The Challenge: Why This Project Matters
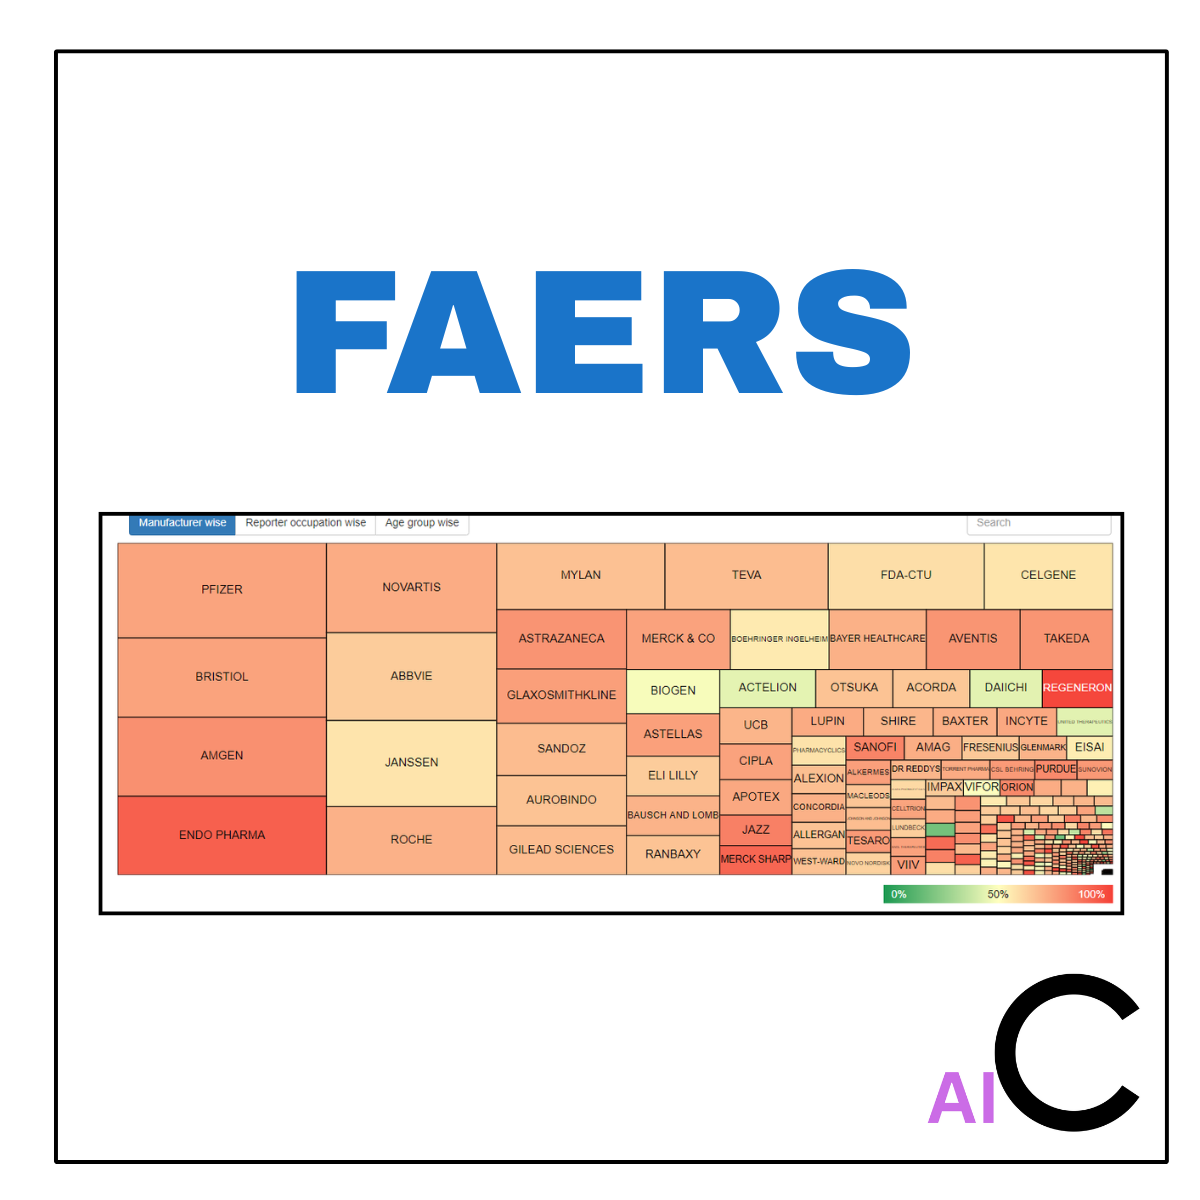
The FAERS database is a monumental repository of information, containing millions of reports submitted by patients, physicians, and other healthcare providers. It is the backbone of post-market safety surveillance in the United States. While its public availability is a treasure for researchers, its raw form presents formidable challenges that stop many aspiring analysts in their tracks:
- Immense Data Volume: With data released quarterly, the full dataset consists of dozens of files and millions upon millions of rows. Handling this volume requires more than just opening a file in Excel; it demands efficient coding and data manipulation strategies.
- Complex, Relational Structure: The data is not in one clean table. It is spread across multiple files for demographics, drug information, outcomes, and reactions, all of which must be correctly merged using unique identifiers to be of any use.
- Lack of Standardization: The “reaction” or adverse event descriptions are often free-text entries. One report might say “heart attack,” another “myocardial infarction,” and a third might contain a typo. Harmonizing this unstructured data into a consistent, analyzable format is a major undertaking.
- Inherent Biases: As a spontaneous reporting system, FAERS database has well-known limitations, such as under-reporting, duplicate reports, and the inability to prove causation (the infamous “correlation is not causation”).
What You Will Learn (Your Personalized Skill Development)
- Post-Market Surveillance Techniques: Understand the workflow of monitoring a drug’s safety profile after it has been approved and is on the market.
- Large-Scale Data Handling: Gain experience manipulating and analyzing massive datasets (often millions of rows) using efficient coding practices in Python.
- Advanced Signal Detection: Apply NLP and data aggregation techniques to identify and rank adverse events, and learn how to stratify results to uncover more nuanced safety signals.
- Effective Safety Reporting: Master the art of communicating complex safety data clearly through targeted visualizations and concise summaries.
- Regulatory Context & Interpretation: Learn to interpret FAERS findings within the proper regulatory context, understanding the data’s inherent limitations and the high stakes of drawing accurate conclusions.
What We Will Do For You (The “Co-Pilot” Process)
- Project Scoping: We’ll help you select an appropriate marketed drug for your analysis.
- Data Extraction & Prep: We will download the latest FAERS data, filter for your specific product, and perform the rigorous data cleaning and structuring required.
- Analysis & Visualization: Our experts will conduct the frequency and demographic analysis and generate a series of visualizations to highlight key safety signals.
- The Co-Pilot Session: We will walk you through the entire process in our signature one-on-one recorded session, explaining the code, the methodology, and the critical interpretation of the results.
Your Final Deliverable Package
You will receive a complete “Project-in-a-Box” containing everything you need to understand and replicate the analysis:
- A Professional PDF Report: A 5-page summary of the methodology, key findings, and data visualizations, ready for presentation.
- The Annotated Code Script: A fully commented Python/R Notebook that shows you every step of the analysis.
- Cleaned Data File: A CSV file of the specific data used in the analysis.
- The “Co-Pilot” Session Recording: A downloadable video of your personalized walkthrough session.
Reviews
There are no reviews yet.